Step 1: Log into the GivEnergy Monitoring Portal at www.givenergy.cloud
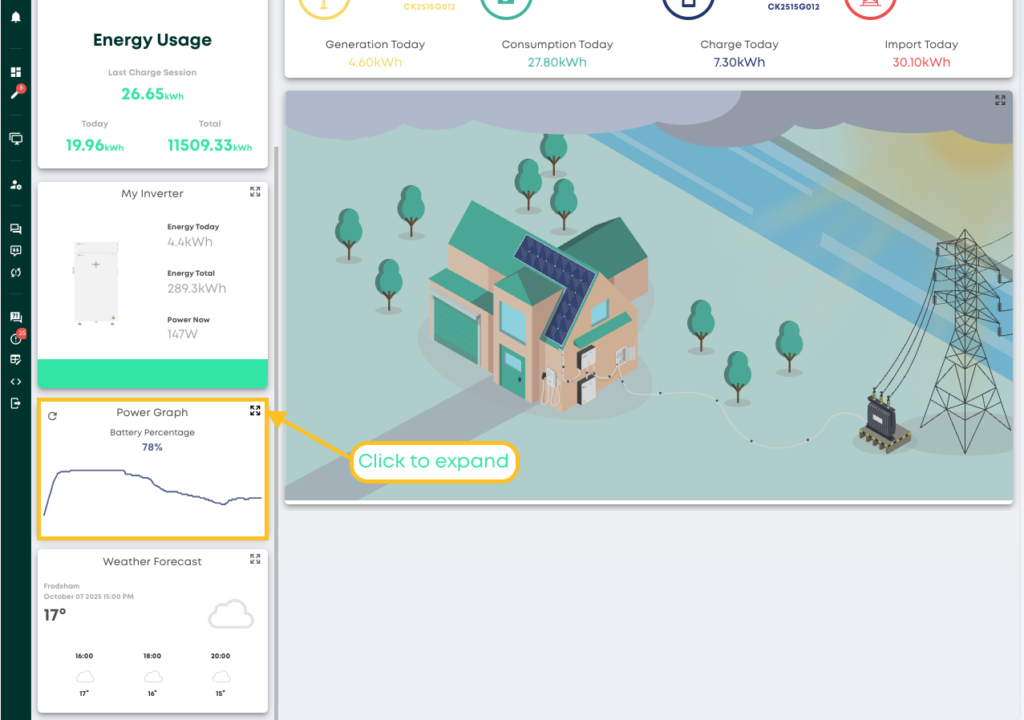
Step 2: After logging in, you’ll be taken to the Monitoring Portal Dashboard. From here, you can view information about your systems import/export data, solar forecasts, tariff savings, and much more.
To view in-depth information about your consumption, you can expand the graph in the top left corner of the Power Graph window.
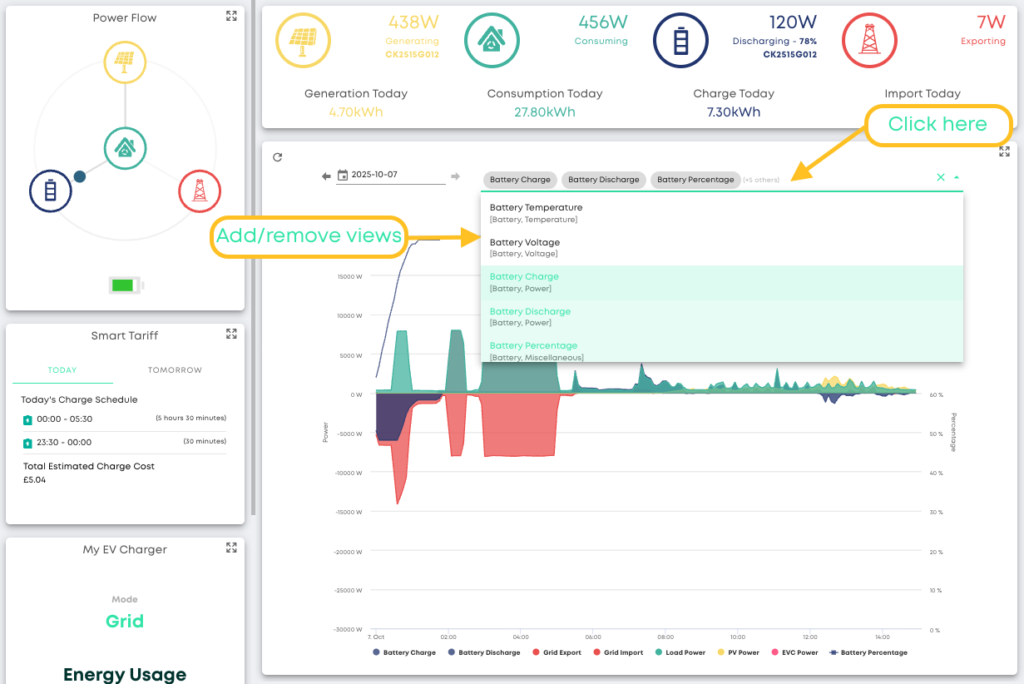
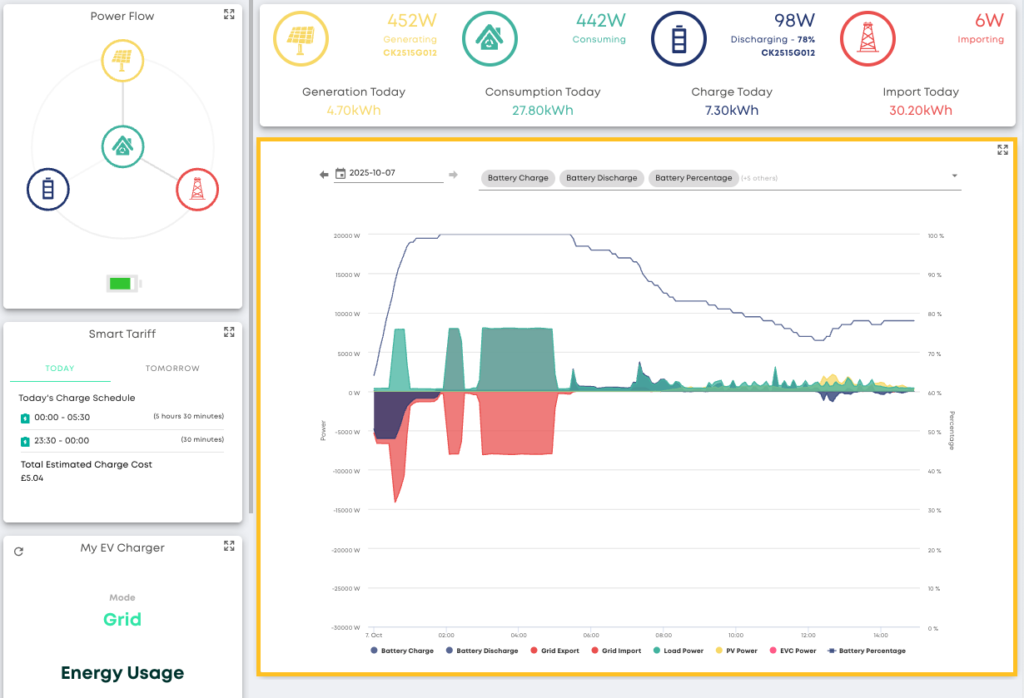
Step 3: In the expanded view, you’ll be able to view a detailed graph about your battery charge and discharge, battery percentage, as well as many other views.
Step 4: To add/remove views, simply click the dropdown arrow and select from the dropdown list